Facebook Social Network Visualization
October 10, 2013
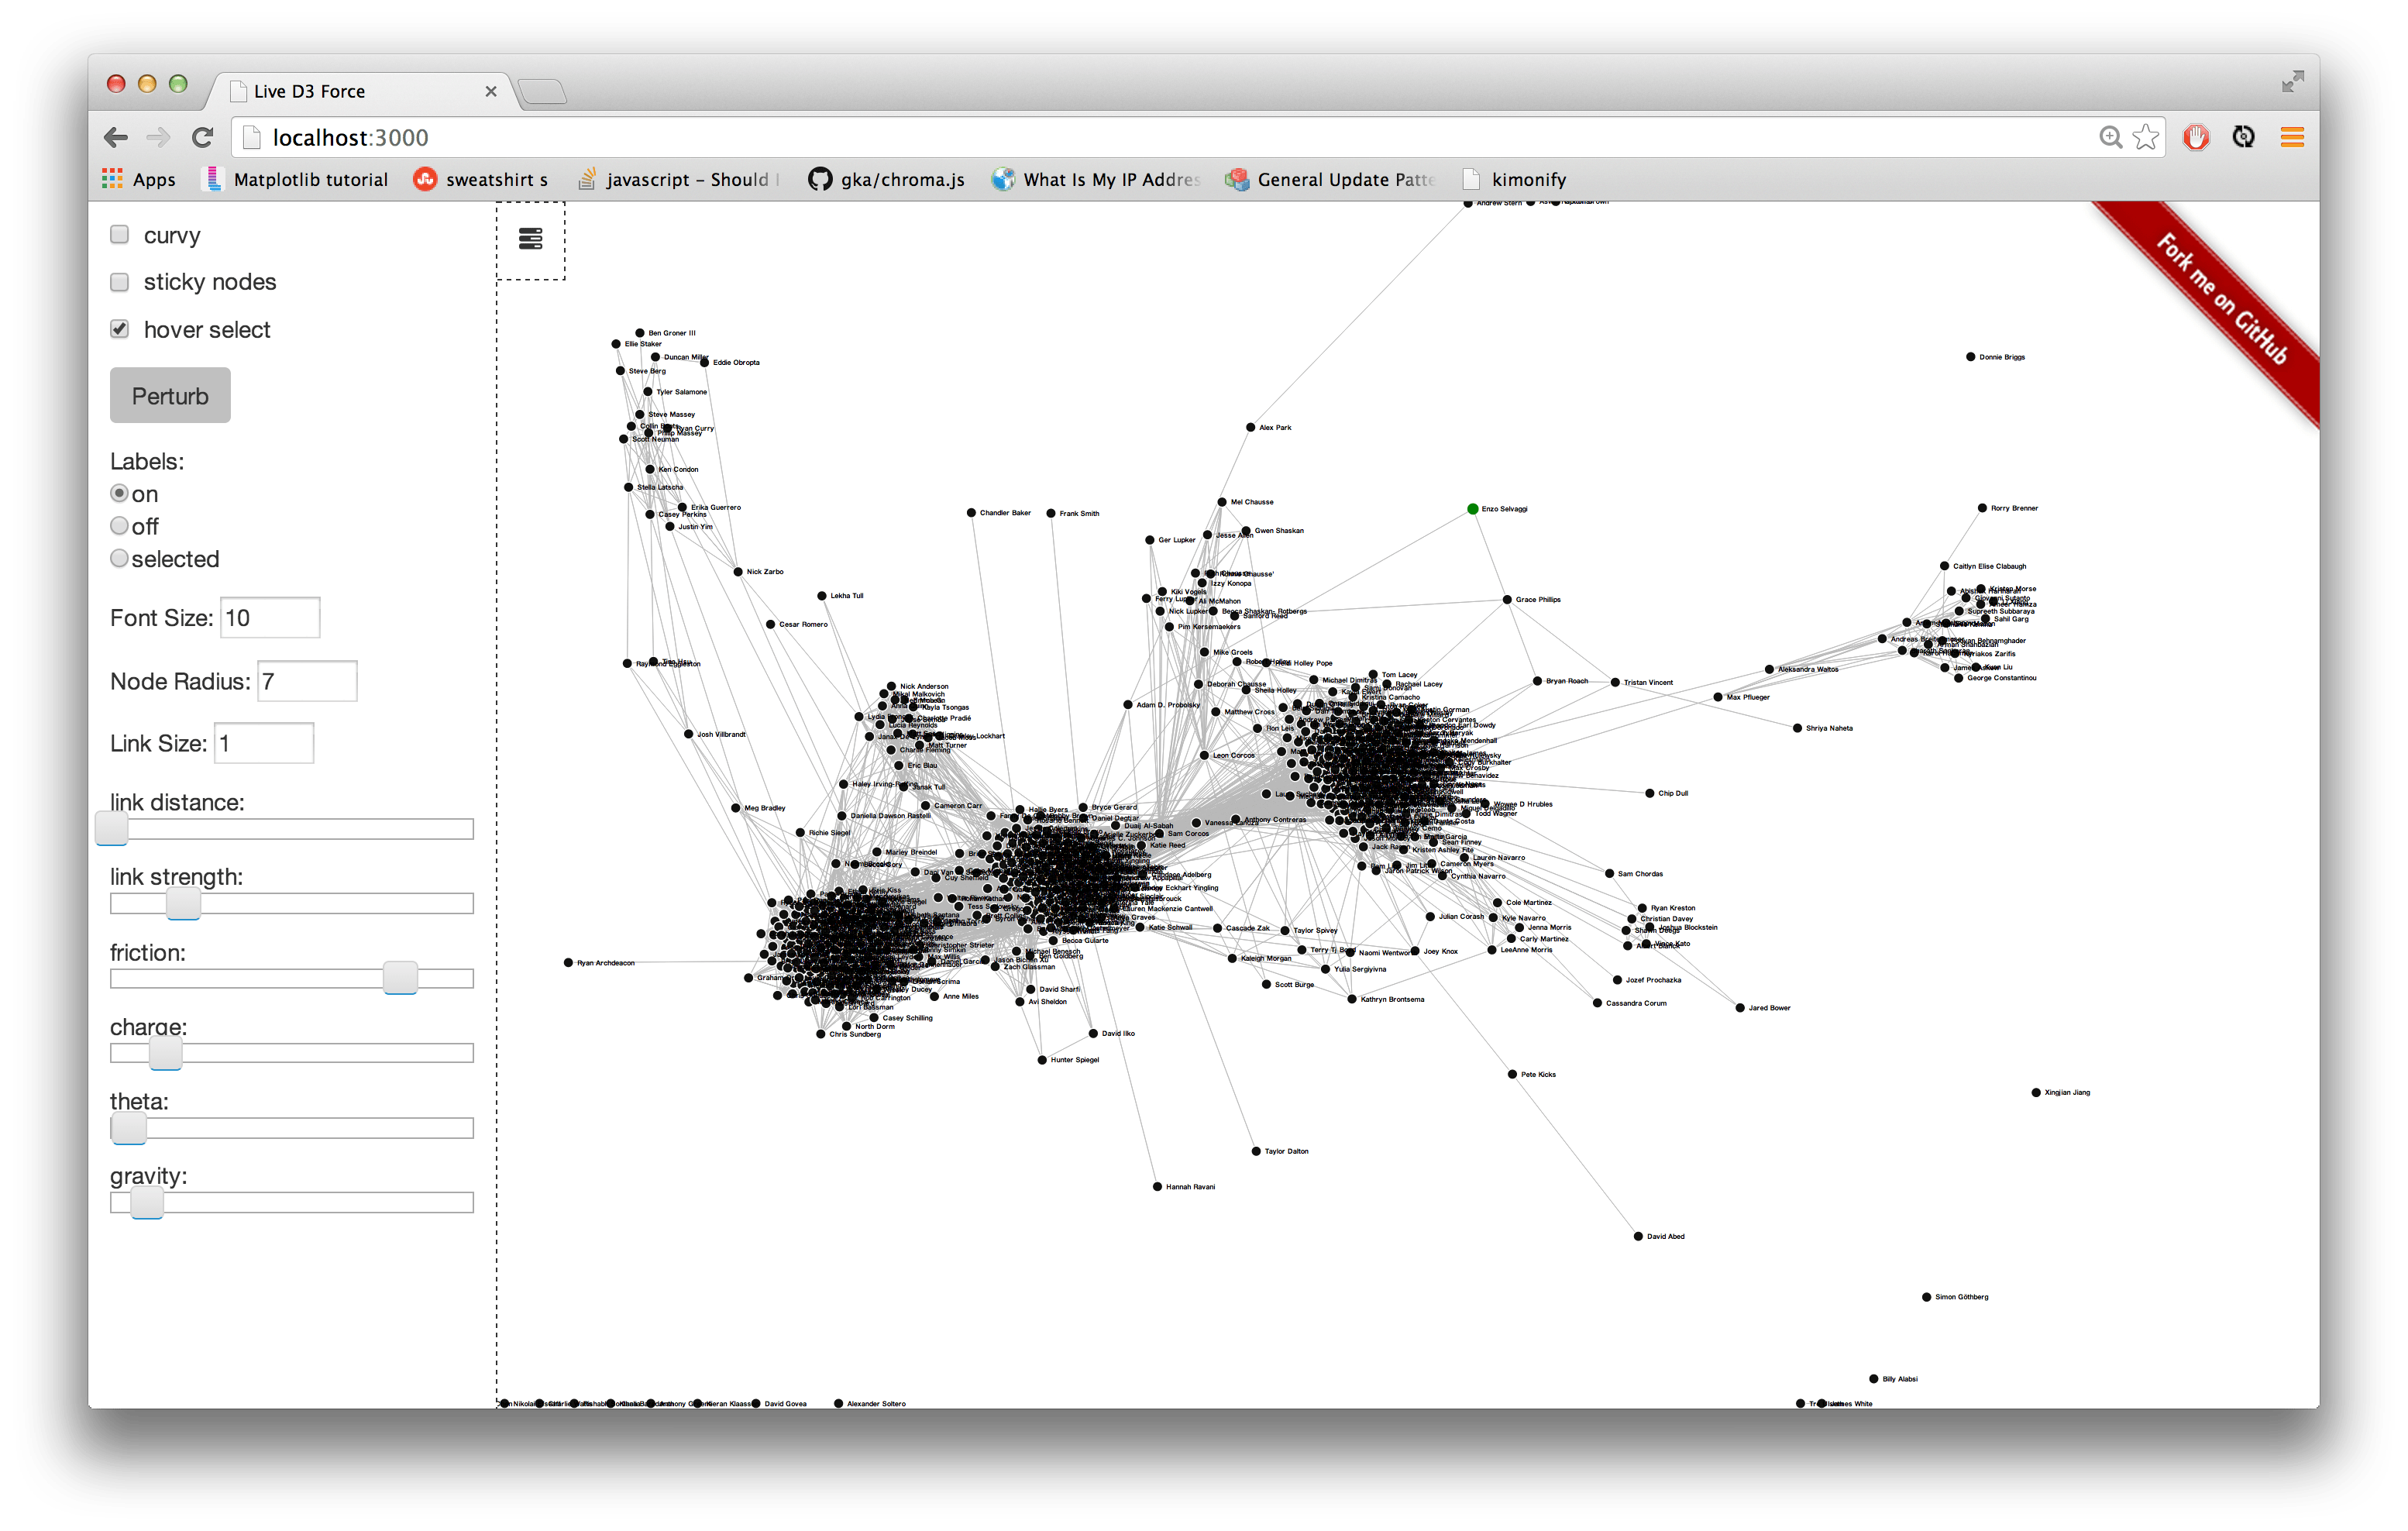
I discovered D3.js the other day and was really impressed with the visualizations produced with it, especially the interactive ones. One of my favorite visualizations is the force directed layout so I set out to make a Meteor app that could reactively add and remove nodes and links from this graph. Here's a live demo!
I thought it would be really cool to visualize my facebook social network using the force directed layout so I set out to download my social graph. This proved to be challenging. Facebook makes it very difficult to do this but I found a loophole that allows me to download my mutual friends with all my other friends using their old API. I made a python library for doing this but I'm not sure this loophole works anymore.
Anyways, I plugged I plugged in my network with 750+ nodes and 20,000+ edges. It took about ten minutes to render and about a second per animation frame – web browsers aren't meant for this amount of computation. I let it run all day until it stabilized and took some screen shots.
In this first image, I'm at the center of the network, linked to all other nodes. This probably made the computation way slower because every node was no more than two links away from every other node. Thus local approximations don't help very much.
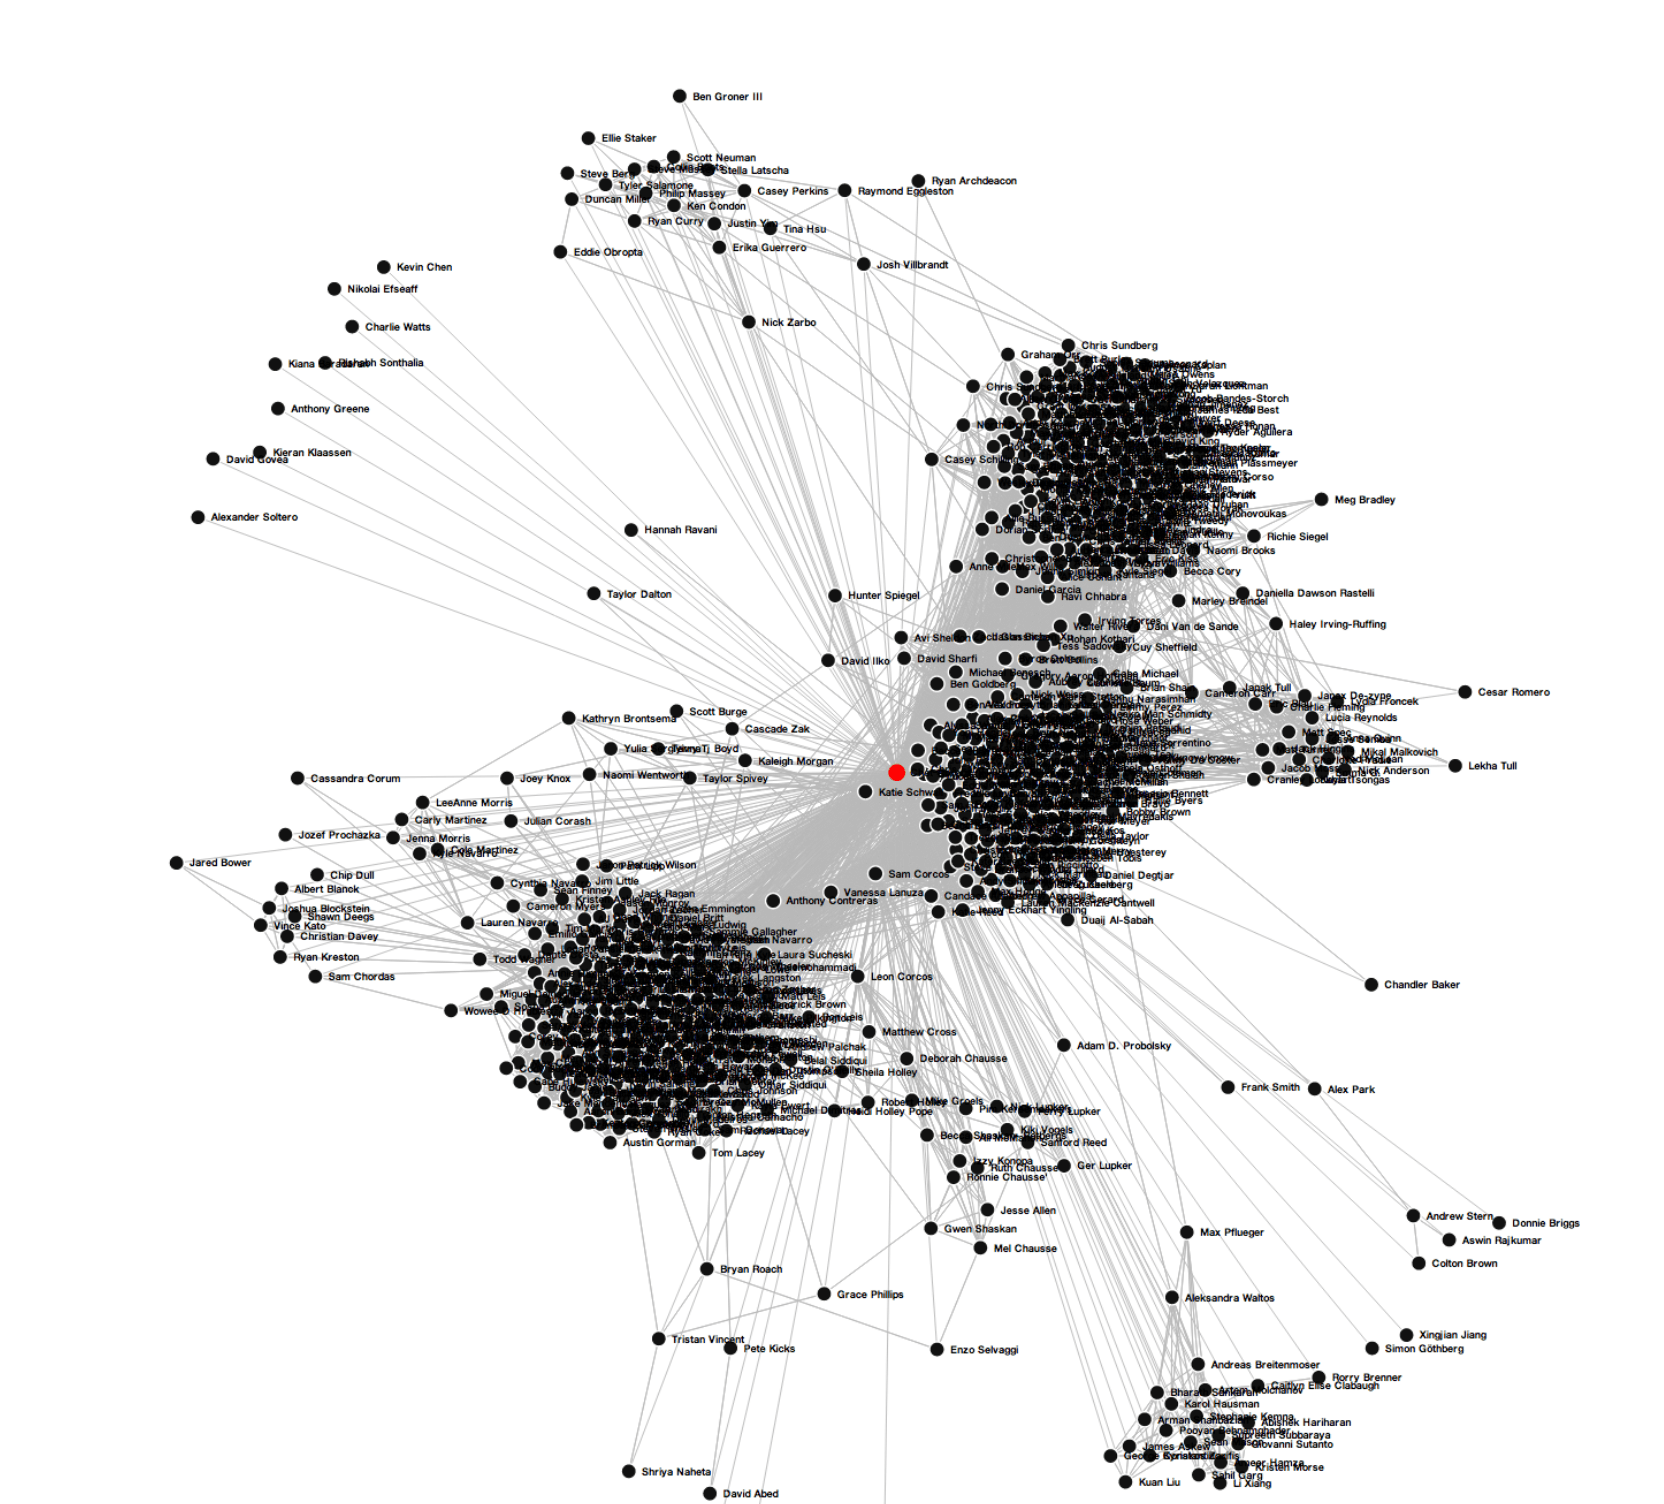
I ran it again removing myself and you can see the structures spread out a bit more. The three main groups are Fair Oaks, Claremont McKenna College, and Harvey Mudd College. The are also some outlying groups that clearly outline Pitzer College, SpaceX, and USC graduate school.